Polinko uses diagrams to show how evidence moves through the system.

The visual record includes evidence maps, research pipelines, runtime architecture, and method history. Each diagram states what it represents and whether it describes current work or an earlier method.

Each diagram type answers a different question.

Sankey
Shows evidence quantity through weighted links between categories.
Research pipeline
Shows how source material becomes cases, checks, and research results.
Runtime pipeline
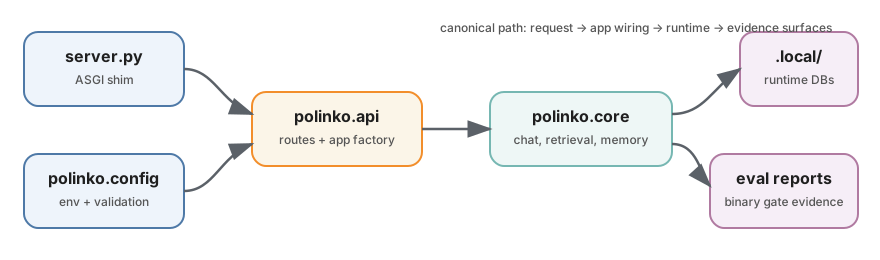
Shows how requests, application wiring, core behaviour, local stores, and eval reports connect inside the working system.
Method pipeline
Shows where judgement enters and whether the visual describes a current or historical method.

Research diagrams make current evidence and implementation context visible.

01 · Evidence Sankey

The Sankey shows how manual-eval evidence contributes to OCR weighting.

This generated D3 diagram maps tagged signal mentions from Beta 1.0 manual evals through outcomes and signal categories into OCR weighting.
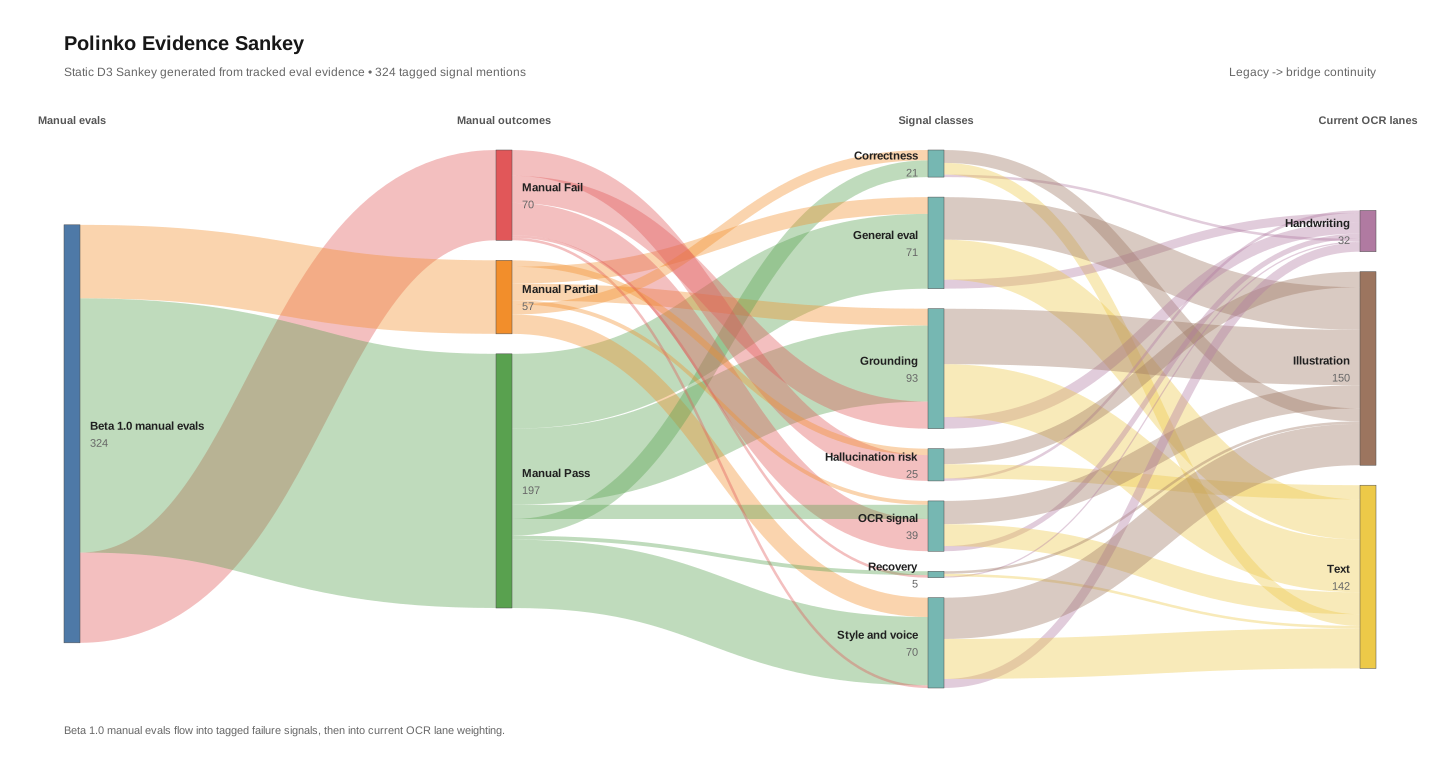
Polinko evidence Sankey showing weighted flows from Beta 1.0 manual evaluations through outcomes and signal classes into OCR lane categories

Link width represents evidence weight.

Use Evidence to read the counts | Open the generated Sankey source

04 · Runtime pipeline

The application pipeline connects runtime behaviour to local stores and evaluation evidence.

Polinko is also a runtime system. Its architecture connects the server and configuration layers to the API, core chat and retrieval behaviour, local databases, and binary eval reports.

Polinko runtime architecture from server and configuration through API and core behaviour into local databases and eval reports

Use Method to read the gate logic | Open the runtime architecture

Beta 2.3 and the retired pulse proposal document two earlier method shapes.

05 · Frozen last-beta pipeline

Beta 2.3 used pass / fail followed by retain / evict for evidence curation.

This tracked Beta 2.3 pipeline describes case or row judgement and the post-failure decision to keep a valid failure or remove malformed, duplicate, or noisy source material.

Frozen Polinko evaluation contract showing source evidence, pass or fail judgement, retain or evict evidence curation, rerun, and interpretation

This remains part of Polinko's evidence history. The current method follows a source-first research model.

Use Method to compare current and historical gates | Open the frozen eval contract diagrams

06 · Historical fail-pressure pulse proposal

The pulse proposal sampled repeated pass / fail checkpoints over time.

This proposal used small, bounded chatbot experiments to test whether timed checkpoints could preserve a behavioural signal before it was summarised as a pattern.

Toy question

One mini chatbot and one exact behavioural boundary.

Live interaction

Behaviour emerges with source context and corrections preserved.

15 to 20 minute pulse

The checkpoint records only pass or fail.

Pulse sequence

Repeated, changed, recovered, or newly failed signals are compared.

Signal

One meaningful binary checkpoint attached to its source interaction.

Pattern candidate

A behavioural shape begins to recur or change across multiple pulses, sessions, or toys.

Polinko decision

The research model determines whether the evidence earns a formal case, question, or bounded claim.

Polinko keeps this visual as method history. Current work uses the source-first method described on the method page.

Use Method to read the current method | Read the historical pulse hypothesis

Read each diagram by role and status.

  • Current diagrams support the active research, evidence, or runtime read.
  • Historical diagrams preserve earlier method shapes without making them current.
  • Evidence links explain the counts and source notes behind a visual.
  • Method links explain the judgement rule behind a visual.
  • Repo links open the source artefact or diagram definition.